
Energy Independence
for American Patriots
for American Patriots
TARIFF ALERT: Solar prices rising 25-40% in 2025 - Secure American-made independence NOW
Your payback period is probably wrong. Solar salesmen use best-case projections, ignore financing costs, and forget about equipment replacement. This guide exposes the 6 hidden killers that stretch a 5-year payback period into 15 years. Three real case studies. One honest calculator. Zero sales pitches.
Your solar salesman's payback projection is a fairy tale. Here are the real numbers.
This is for the homeowner in suburban Houston whose solar salesman promised a 6-year break-even but forgot to mention the 7.2% financing that adds $6,800 in interest.
For the retired teacher in Arizona paying $0.14/kWh who needs to know if solar math works at her rate or if the salesman is just chasing commission.
For the rancher outside San Antonio who got three different payback projections from three different installers and cannot figure out which one is telling the truth.
For the family in rural Ohio paying $0.09/kWh who needs someone honest enough to say "solar might not make financial sense for you."
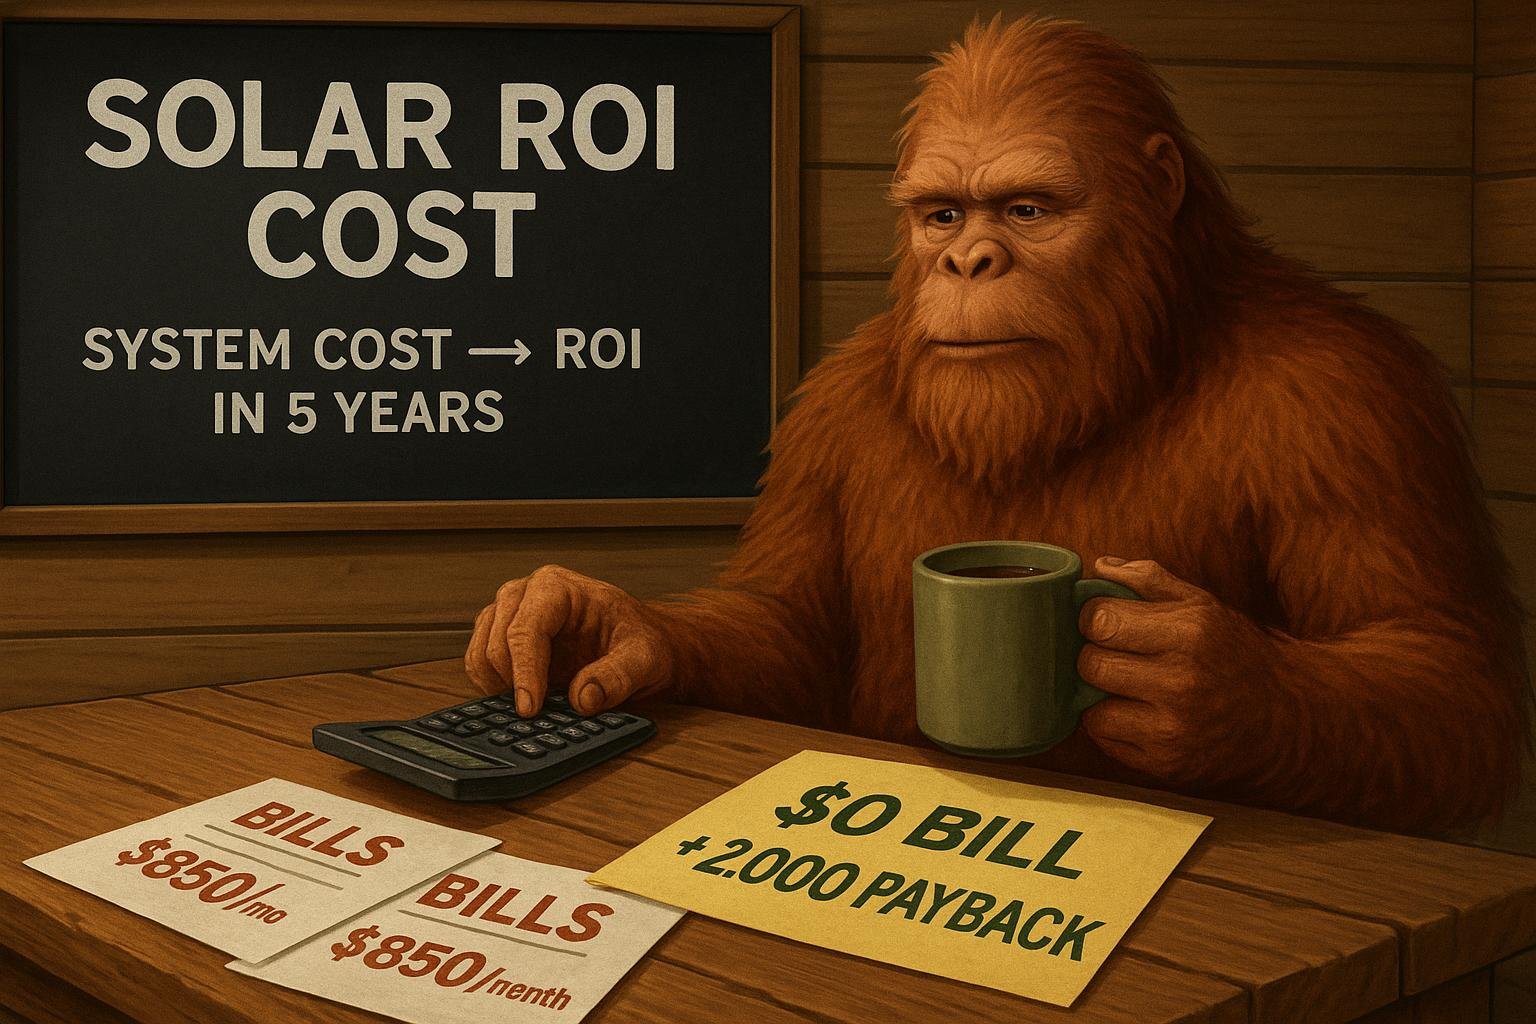
Your break-even timeline is the most important number in your solar decision. This guide makes sure you calculate it honestly.
The guideline: Under 7 years is a great investment. 7 to 10 years is decent. Over 10 years means something is wrong.
The biggest factor: Your electricity rate. At $0.52/kWh, payback can be under 5 years. At $0.09/kWh, it stretches past 15 years.
The 6 killers: Financing costs (adds 30-40% to system cost), equipment degradation (0.5-0.8% annual loss), maintenance ($350-$700/year), production shortfalls (10-15% below projections), net metering policy changes, and hidden installation costs ($3,000-$15,000).
The bottom line: Cash purchase at high electricity rates with proper sizing delivers the best payback period. Financed systems at low rates may never break even.
I sat at my kitchen table staring at a $312 electric bill. That was a good month. Summer pushed $450 to $500. My rate? $0.52 per kilowatt-hour. Annual cost: over $3,800 just to keep the lights on.
Told my buddies I was researching solar. They said I was crazy. "Too expensive." "Never recoup that." "Just a fad for tree-huggers."
Even my electrician said he thought I was making a mistake.
They were all looking at electricity prices from 10 years ago. They were not looking at the trajectory. My rates climbed 4 to 6% every single year. The math they refused to do showed a break-even under 5 years. Not the 15-year timeline everyone warned about.
I have not paid an electric bill in 6 years. My utility company owes me money from excess production credits. My break-even was 4.8 years. Everything since then is pure profit.
"Everyone who told me solar was a waste was doing someone else's math. Not their own. Your break-even number is not my break-even number. Your rates are not mine. Your solar exposure is different. Run YOUR numbers. That is why we built the calculator. Because the only payback period that matters is yours."
Enter your specific numbers. Get an honest payback calculation that includes financing costs, maintenance expenses, equipment replacement, tax incentives, and realistic savings based on YOUR rates.
Launch Payback Period CalculatorMost people think payback period just means "when do I start making money." That is only part of it. Your break-even reveals three critical truths about your investment.
The longer the payback period, the longer you are exposed to equipment failure, policy changes, net metering cuts, and property sale before recouping investment. A 5-year break-even means 5 years of risk. A 15-year timeline means hoping nothing goes wrong for a decade and a half.
| Investment Option | Initial Cost | 20-Year Return | Annual ROI |
|---|---|---|---|
| Solar (5-yr payback, high rates) | $25,000 | $87,000 | 11.8% |
| Solar (8-yr payback, medium rates) | $25,000 | $67,000 | 8.2% |
| S&P 500 Index Fund (historical avg) | $25,000 | $96,000 | 10.5% |
| Solar (15-yr payback, low rates) | $25,000 | $38,000 | 4.1% |
With a 5-year payback period, solar beats the stock market. With 8 years, it is competitive. With 15 years, you would have been better off investing elsewhere. The U.S. Department of Energy solar guide confirms that electricity rate is the dominant factor in residential solar ROI.
A $25,000 system with a 5-year payback period puts you in profit by year 6. A 15-year timeline means you might be retired before you see real returns. That gap changes the entire decision.
Solar salesmen show beautiful projections based on perfect conditions. Reality is messier. These 6 factors stretch break-even timelines far beyond what the brochure promised.
I paid cash. Best decision I made. Here is why:
| Payment Method | System Cost | Total Paid | Payback Period |
|---|---|---|---|
| Cash purchase | $25,000 | $25,000 | 8.2 years |
| Solar loan (6.5%, 12 yr) | $25,000 | $32,400 | 11.7 years |
| Solar loan (9%, 12 yr) | $25,000 | $35,600 | 13.2 years |
| Solar lease (20 yr) | $0 upfront | $18,000 | Never (you do not own it) |
That interest turned an 8-year break-even into 12+ years. Solar leases are worse. You never own the system. Never get the tax credits. Never actually break even.
Panels lose 0.5 to 0.8% efficiency annually. After 10 years, output drops 5 to 8%. After 20 years, down 10 to 16%. But the real cost killer is inverter replacement at 10 to 15 years. Budget $3,000 to $5,000 for that. Most projections ignore it.
Budget 15 to 20% of your initial system cost for equipment replacement over 20 years. For a $25,000 system, that is $3,750 to $5,000. Add that to your ROI calculation or your projections are fantasy.
Annual maintenance runs $350 to $700. Panel cleaning: $150 to $250. Electrical inspection: $100 to $200. Inverter servicing: $50 to $150. Performance monitoring: $50 to $100. Over 20 years? That is $7,000 to $14,000 less in your pocket. For detailed maintenance protocols, see our panel cleaning and maintenance guide.
Contractors use "perfect conditions" for projections. Real life includes tree growth creating unexpected shading, dust and pollen reducing efficiency 5 to 10%, weather patterns worse than "average," snow coverage, and bird droppings. The National Renewable Energy Laboratory documents consistent gaps between projected and actual residential solar production.
States that offered full retail credit rates have cut them to wholesale rates. That is 40 to 60% less value for your excess production. Your break-even calculation from 3 years ago may be obsolete if your state changed net metering rules. Check current policies before committing.
Costs that appear after the initial quote: electrical panel upgrade ($1,500 to $4,000), roof repair ($2,000 to $8,000), permit fees ($500 to $2,500), tree trimming ($600 to $5,000), and trenching ($1,000 to $5,000). For the complete breakdown, see our Hidden Costs Guide.
If the installer says "we will assess that during installation," get a worst-case estimate in writing before signing anything. Verbal estimates protect nobody except the installer.
Three real installations. Three different outcomes. Your payback period depends entirely on your specific situation.
System: 12 kW. Total investment: $22,000 (cash). Monthly savings: $185. Payback period: 6.8 years.
What Mike did right: Paid cash. Maximized the $6,600 federal tax credit. Perfect solar exposure. High electricity rates at $0.13 to $0.15/kWh. Completed energy efficiency upgrades first. Right-sized the system at 90% offset.
System: 8 kW. Total investment: $28,500 (financed). Monthly savings: $145. Payback period: 12.4 years.
What went wrong: Financed at 7.2% ($6,800 in interest). Net metering rate cuts reduced value 30%. Higher maintenance than projected. Inverter replacement at year 11. Tree growth created shading. Sarah's break-even doubled because of financing and policy changes she did not anticipate.
System: 10 kW. Total investment: $35,000 (financed at 9.9%). Monthly savings: $95. Payback period: 18+ years.
The perfect storm: Massively oversized system. Poor solar exposure. Low electricity rates at $0.09/kWh. Predatory financing. No tax liability to use the credit. Installation problems. Bob's break-even timeline exceeds most equipment warranties. Someone honest should have told him to walk away.
"Bob's story is the one that keeps me up at night. Good man. Bad advice. A decent installer would have told him solar did not make financial sense at $0.09/kWh with no cash and no tax liability. Not every property is right for solar. Sometimes the honest answer is no. That is why we built a calculator that gives you the truth instead of a salesman projection."
Our calculator includes financing costs, maintenance, equipment replacement, tax credits, and realistic production estimates. No cherry-picked numbers. No best-case fantasies.
Calculate Your Real Break-Even TimelineReduce consumption first. Smaller system needed. Lower cost. Faster break-even.
| Efficiency Investment | Consumption Cut | System Size Reduction | Total Savings |
|---|---|---|---|
| $3,000 (insulation + LED) | 25% | 3 kW smaller | $7,500 |
| $5,000 (heat pump + windows) | 40% | 5 kW smaller | $12,500 |
| $8,000 (complete efficiency) | 50% | 6 kW smaller | $15,000 |
The sweet spot is 85 to 95% offset. Oversizing wastes money on excess production you cannot use at full value. Right-sizing shortens break-even by 1 to 3 years on most systems. For system sizing guidance, see our System Design and Planning Guide.
Pay cash if possible. Then invest your monthly "solar payment" in index funds at 7 to 10% returns. On a $25,000 system saving $200 per month, that is an additional $65,000 in wealth over 20 years. Cash purchase delivers the shortest break-even and the highest total return.
This is the single biggest factor. At $0.52/kWh, every kilowatt saves serious money. At $0.09/kWh, the math collapses. Know your rate before you talk to a single installer.
Calculate your exact break-even timeline with all 6 killers factored in. Financing costs, maintenance, degradation, and real production estimates. Instant results.
Download Free ROI CalculatorEverything after break-even is pure profit. I reached break-even at 4.8 years. For the last 6+ years, I have been banking pure savings.
| Period | Cumulative Savings | Notes |
|---|---|---|
| Years 1-5 (payback phase) | $0 net (recovering investment) | System cost offset by savings |
| Years 5-10 | $19,200 profit | Pure savings, zero electric bills |
| Years 11-25 (projected) | $57,600 additional profit | Accounting for degradation and maintenance |
| Total 25-year ROI | $89,750 net profit | 14.3% effective annual return |
Energy independence: When the grid goes down, I am still running. When rates skyrocket, I do not care. That peace of mind has value no spreadsheet captures.
Property value: Solar adds roughly $4 for every $1 in annual savings to home value. My system saves $3,200 per year. That is approximately $12,800 in added property value.
Emergency preparedness: With battery backup, my family has power during outages. For families in hurricane zones, wildfire areas, and ice storm regions, that is not a luxury. It is a requirement. For complete emergency power planning, see our Emergency Preparedness Guide.
For location-specific break-even estimates based on your electricity rate and solar exposure, use our OffGridPowerHub GPT assistant and enter your zip code.
Return to our Pillar 6: Cost Analysis and ROI Master Guide for the complete financial framework.
Under 7 years is excellent. 7 to 10 years is decent. Over 10 years means something is wrong with pricing, financing, or system design. Electricity rate is the single biggest factor.
A system with an 8-year cash payback stretches to 12 years at 6.5% interest and 13 years at 9%. Solar leases never pay back because you never own the system. Cash purchase delivers the shortest break-even timeline.
Six killers: financing interest, equipment degradation, maintenance ($350-$700/year), production shortfalls, net metering changes, and hidden installation costs ($3,000-$15,000 in panel upgrades, roof repairs, permits, and trenching).
It is the single largest factor. At $0.52/kWh, payback can be under 5 years. At $0.15/kWh, expect 7 to 10 years. At $0.09/kWh, payback stretches past 15 years and solar may not make financial sense.
Panels degrade 0.5 to 0.8% per year. After 20 years, output drops 10 to 16%. Inverter replacement at 10 to 15 years adds $3,000 to $5,000. Budget 15 to 20% of system cost for replacement over 20 years.
Cash always delivers the shortest payback period. A $25,000 system paid cash pays back in 8.2 years. Financed at 6.5%, it takes 11.7 years. At 9%, 13.2 years. If you must finance, keep interest under 5% with a term under 10 years.